Below is a script that I started writing back at the LMB. It visualizes 3D classification jobs from RELION and should be compatible with the most recent version (3.1). In principle it also works for 2D classification, but some of the labels are a bit hard to read :). I tried to keep the script flexible, but if something breaks, please feel free to reach out.
On GitHub: class-wiz.py
Download script here (right click –> ‘Save Link As’): class-wiz.py
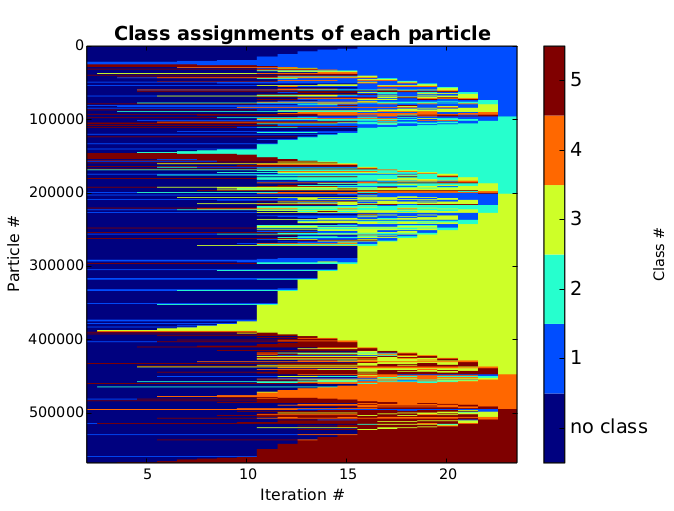
The output PDF file has various flavors of information. It starts with some plots about the convergence behavior:

Show how particles jump around between classes (bare in mind that with the ‘use small subset’ option, things might look a bit funky):

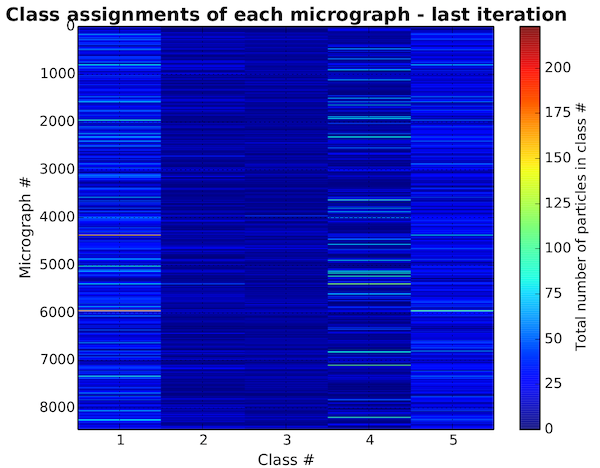
Visualize how certain micrographs contribute to classes, which might be important for merging datasets or to look at any kind of systematic drift during data collection:

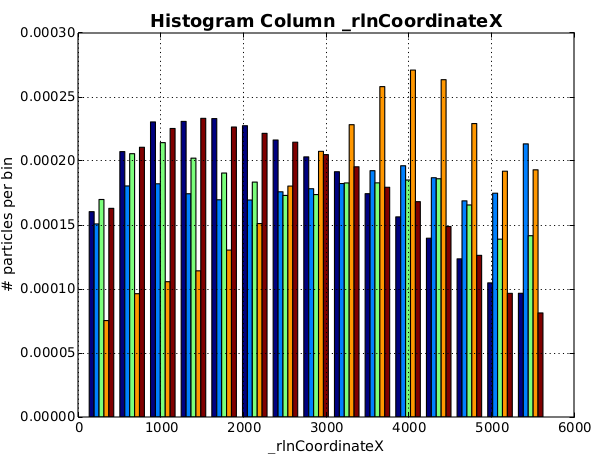
…to histograms about every single column in the last data.star file. Classification sometimes does interesting things, such as classifying particles based on defocus, coordinates (which might be an indication of varying ice thickness) etc.
